How to use the database filters
Being able to filter through agencies in the main database is a way to highlight and prioritise which agencies would have the biggest impact to your goals or your business.
Since the agencies in the database are enriched with a lot of data points, we have the ability to filter on the following:
- Agency Name
- Agency Portfolio Revenue
- Agency Specialization
- Agency Employee Count
- Agency Tech Partners
- Agency Tech Platforms
- Agency Clients
- Agency Locations (e.g London - England, New York - United States)
- Agency Region (e.g EMEA, APAC)
Alongside those filters, where agencies have client data attached to them, we can also filter agencies based on their client data as follows:
- Client Platform
- Client Country
- Client Revenue
- Client Category
- Client Employee Count
The core use-case for this feature is that I want to find the most relevant and impactful agencies that can drive the revenue for my goals.
Here’s how to use it:
-
Quick Filters
- If you’re just looking to get a top-level view of the agencies in the database without more detailed filtering, you can use our quick filters at the top of the table
- This enables you to quickly filter by the following data points in 2 clicks:
- Agency Name
- Agency Portfolio Revenue
- Agency Specialization
- Agency Employee Count
- Agency Tech-partners
- Agency Tech-platforms
- Agency Location
- Agency Client name
- For example, if I wanted to find all agencies that are in Manchester - UK, that have >10 employees, I would use those 2 filters:
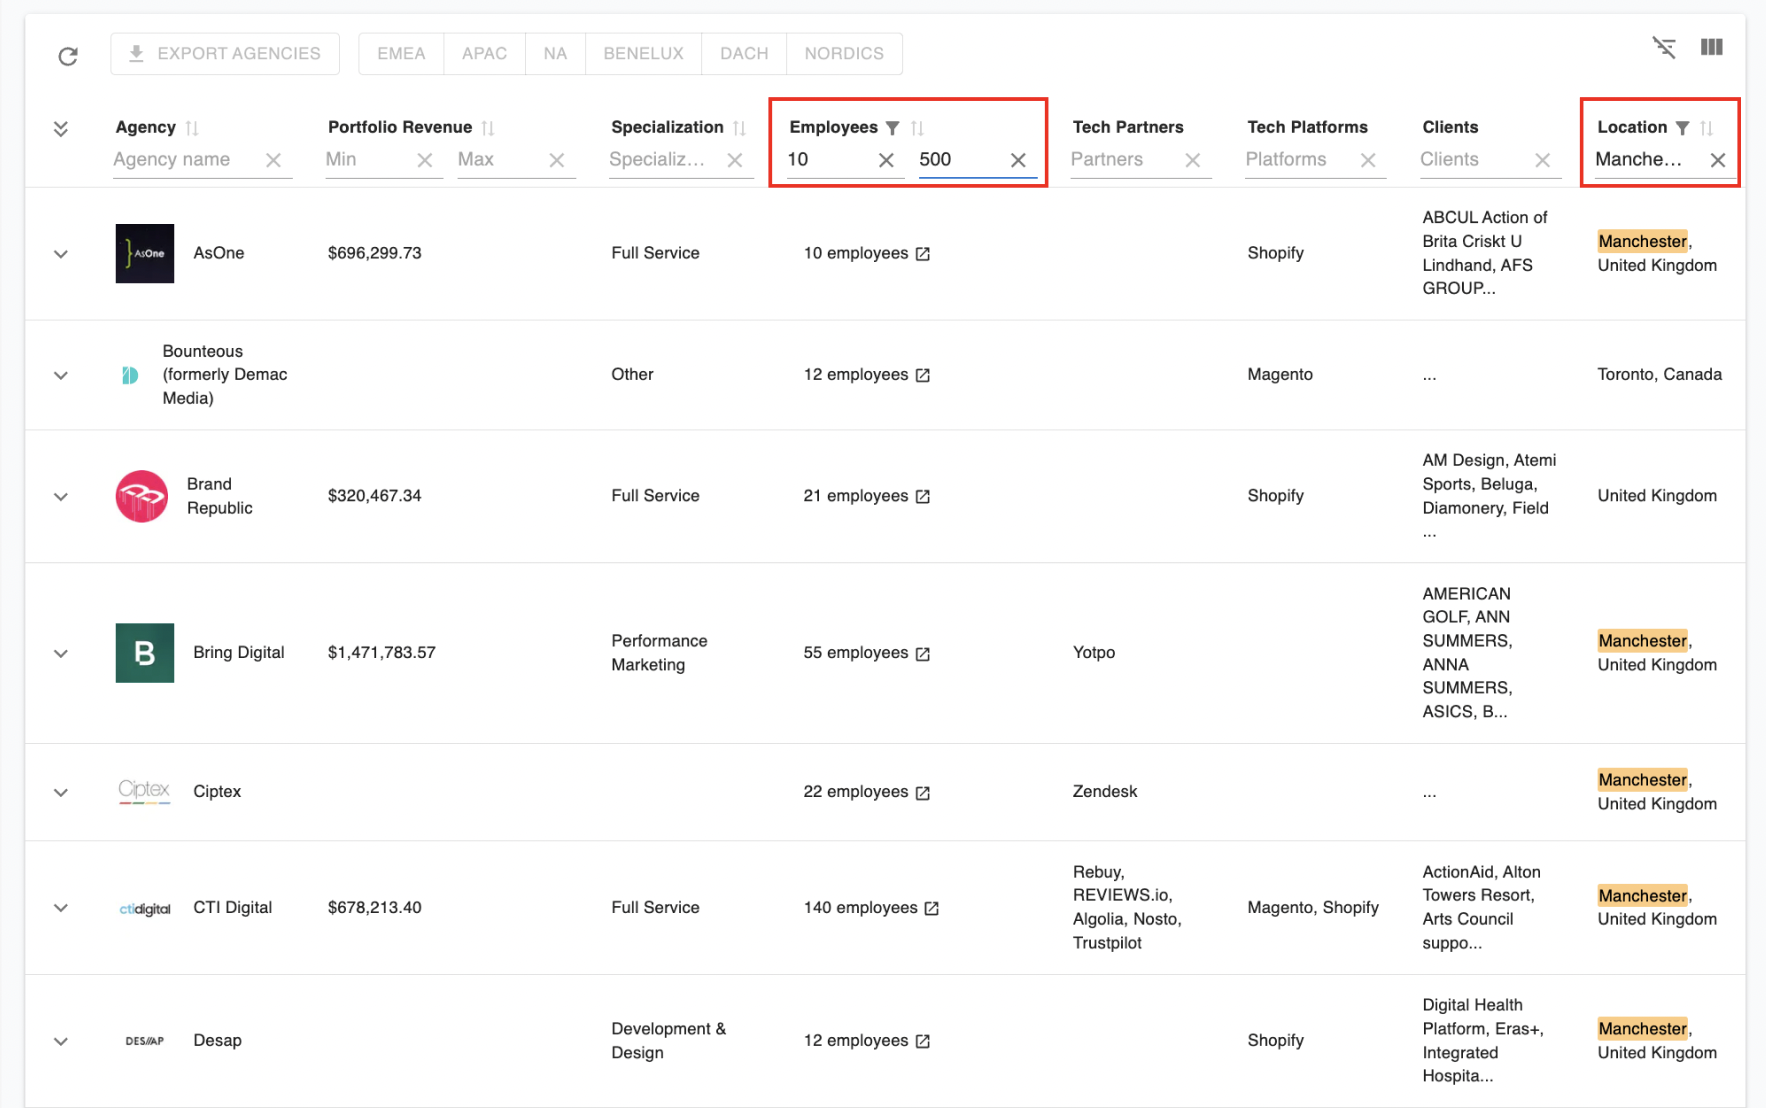 This immediately delivers 24 results of those relevant agencies.
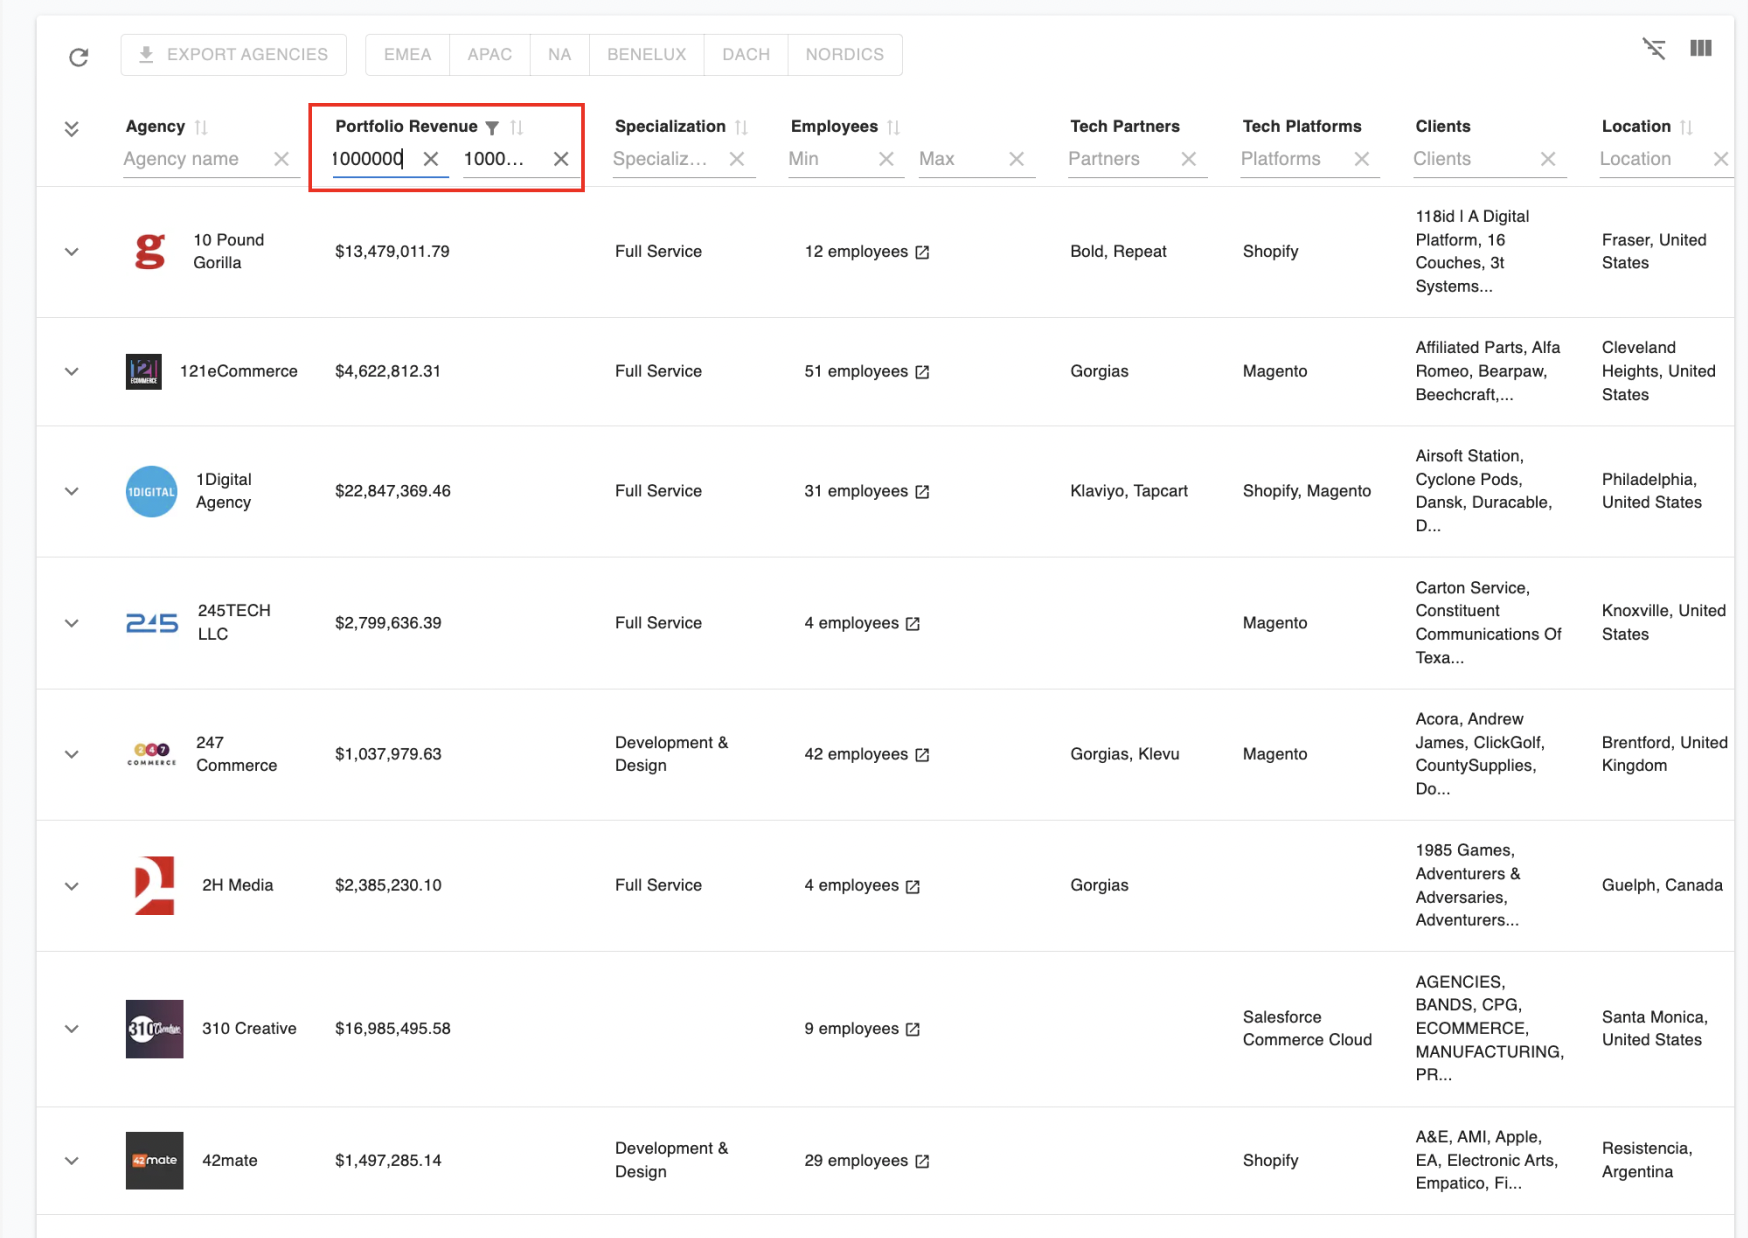
 - Another example might be that I want to find all the agencies in EMEA that have a Portfolio revenue of >$10m. In that case, I would use those filters:
-
Exporting that data
- If you’re happy with your initial search, you can then export your results with the “Export Agencies” button in the top right.
- Note, exports will only work if a tech-partner or location is also selected.
- Exports are formatting with all the following data:
- Agency Name
- Agency Domain
- Portfolio Revenue
- Specialisation
- Employee Count
- Agency Location
- Tech-partners
- Tech-platforms
- Client Names
- Client Locations
- All client data attached to an export is segmented with individual rows for easier CRM uploading.
-
Rule and group filters
- If you’d like to filter by multiple conditions at the same time, or filter by agencies client data, head to the top right section above the table with “Rule” and “Group” buttons
- “Rule” defines which data point to filter by (E.g client name or employee count)
- “Group” enables you to add another rule alongside it, so multiple filters are acting on the table
-
Between, Contains, and Equals selectors
- When choosing different filters, depending on which kind of datapoint you are choosing, there are different ways to define your specific value for that data point
- For example, the following selectors are available in the database:
- For numerical values you can choose “between” to define a range of values
For example, this could be when you want to filter by Agency Portfolio revenue, you can choose 2 values:

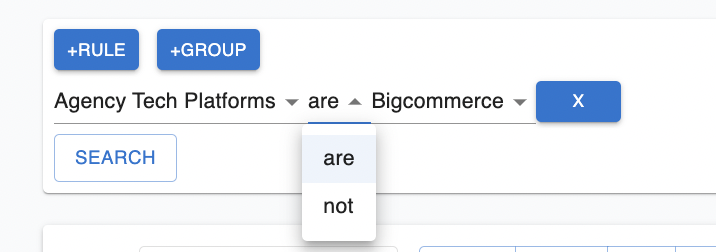
- For defined values in the database, you can choose “are” or “not” to define whether you want to view results that include or exclude that value
For example, this could be when you want to filter by tech platform:
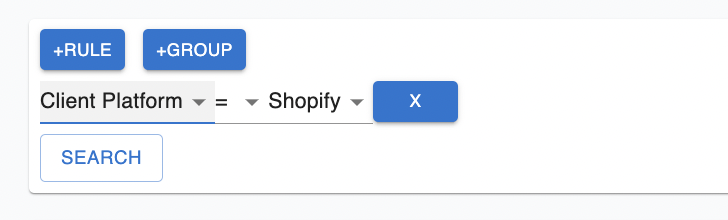
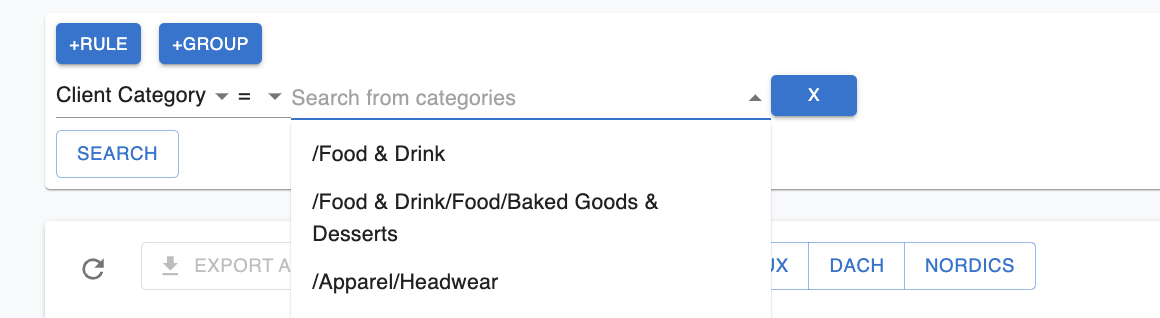
- For client data points, there will be an “=” option for you to choose from a drop-down menu
- For example, this could be client platform:
- Or client category:
- For example, this could be client platform:
- For numerical values you can choose “between” to define a range of values
For example, this could be when you want to filter by Agency Portfolio revenue, you can choose 2 values:
-
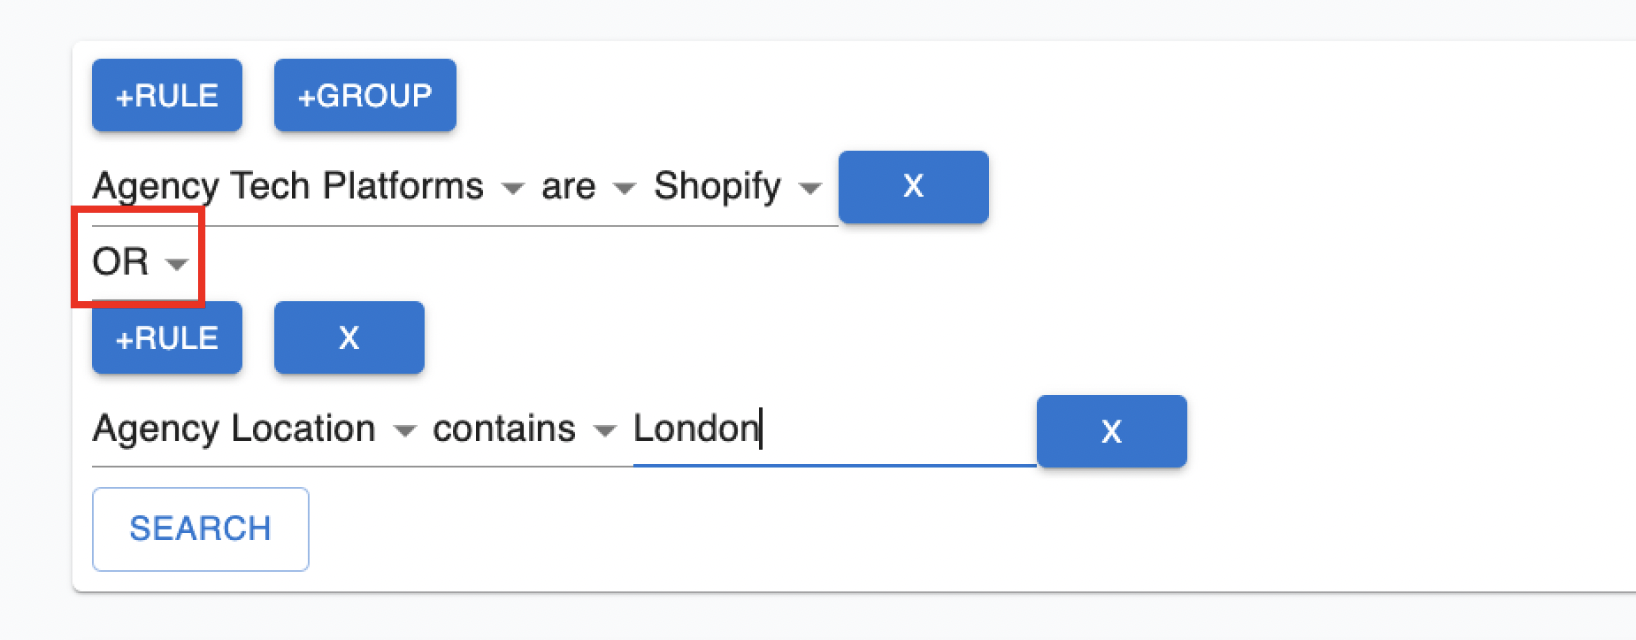
And, Or selectors
When choosing multiple filters together with the “Group” button, you can choose And / Or options to filter the data
- Choosing “And” will mean that your filter 1 and filter 2 will both have to be present in the data. For example, agencies that are on Shopify AND in London
- Choosing “Or” will look at each filter individually, and show both results together. For example, agencies that are on Shopify OR in London
-
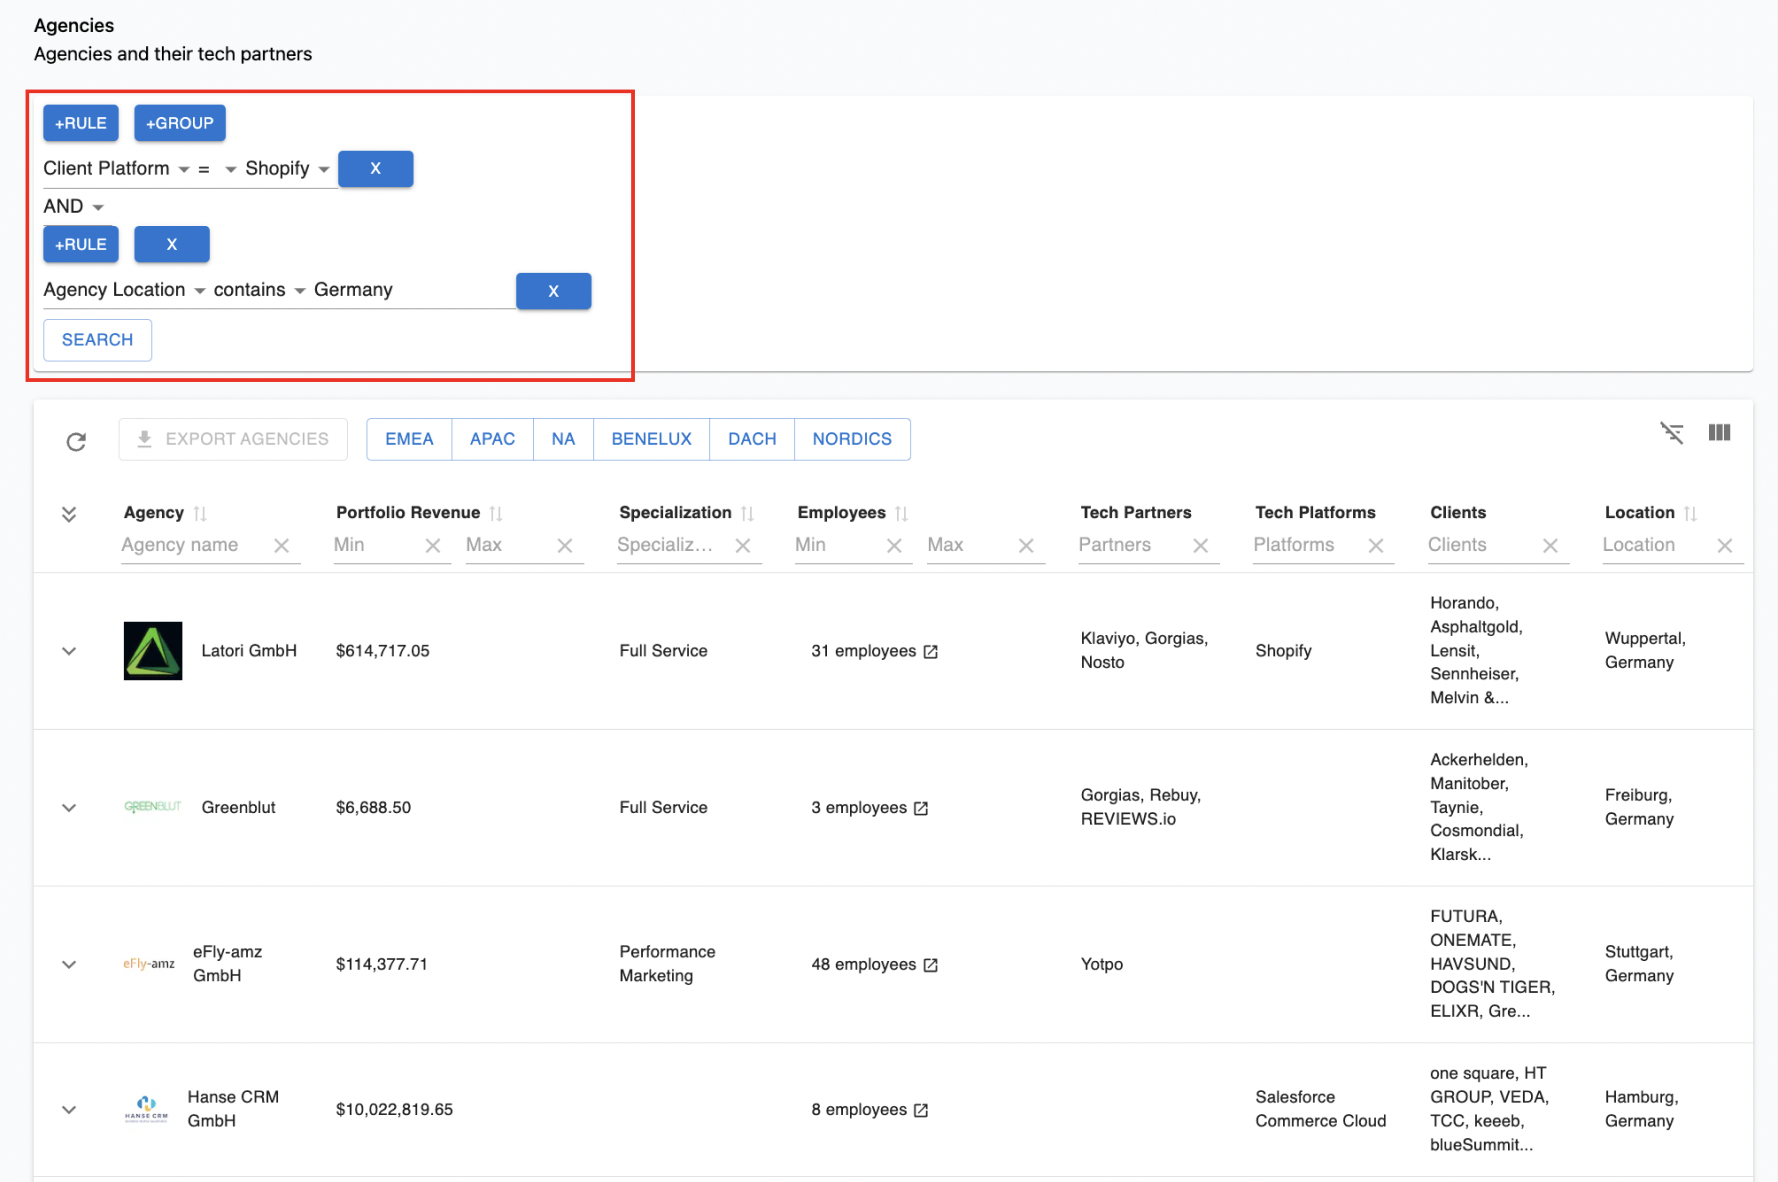
Using a Rule and Group filter
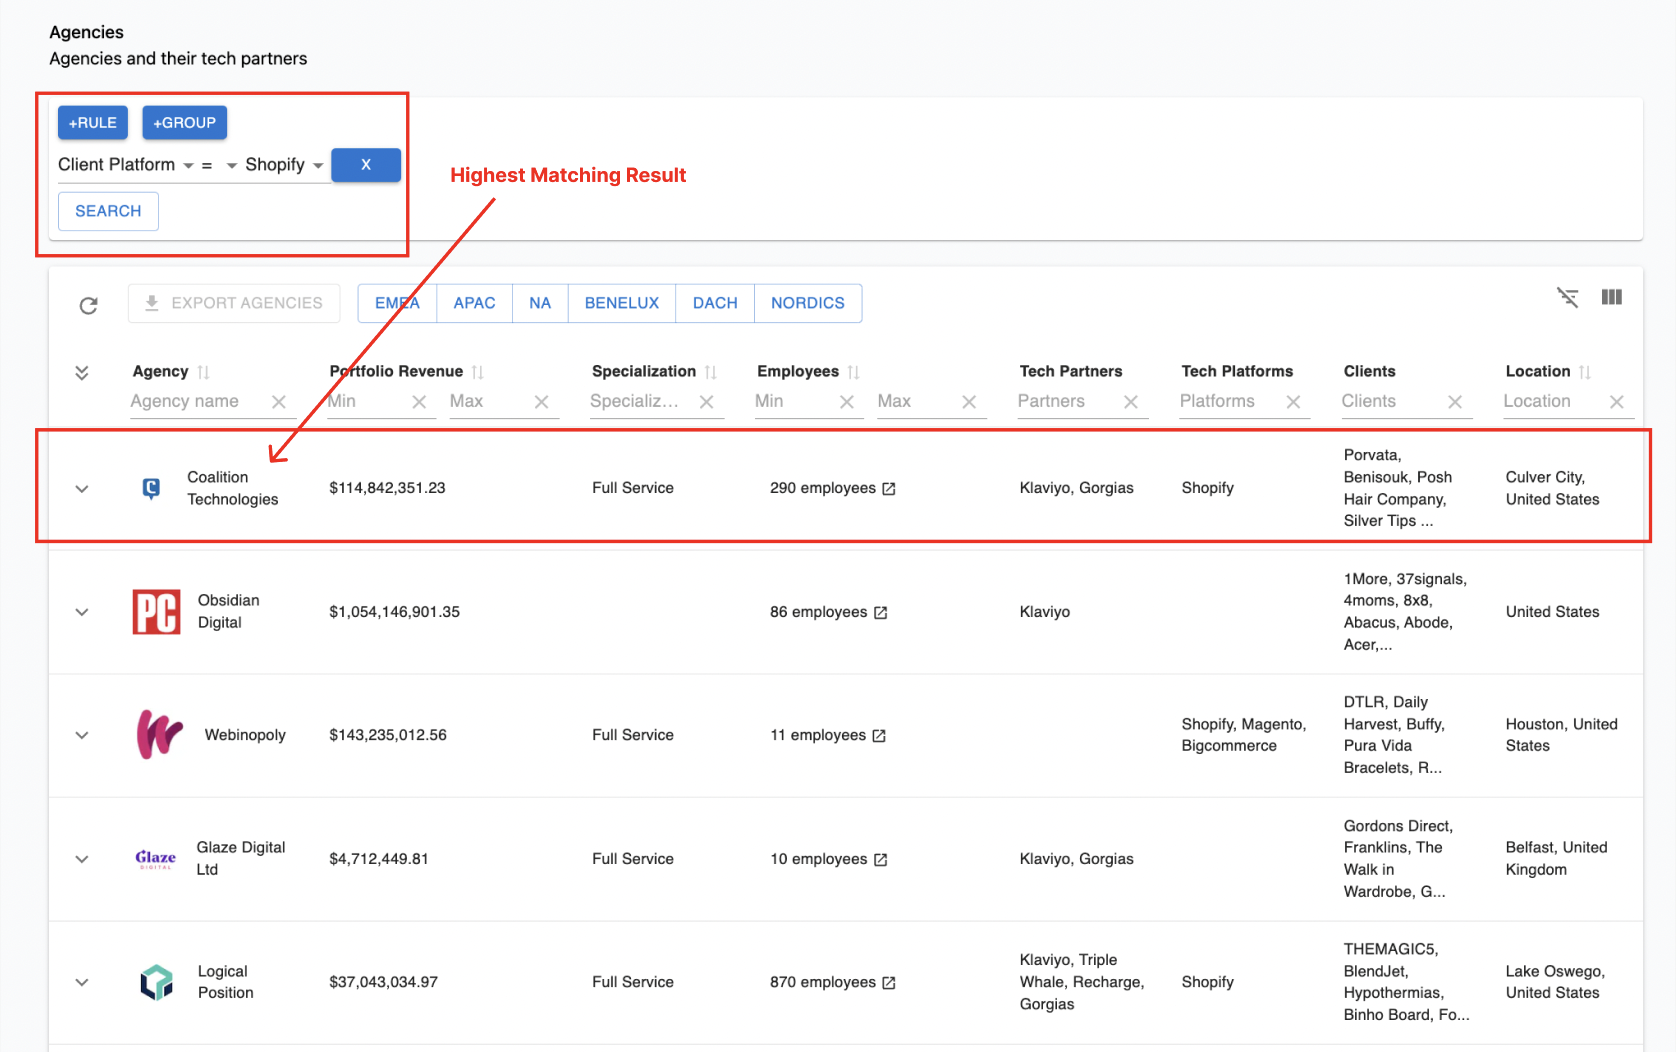
Once a filter is selected, the table will show most to least that matches your filters. For example, if I wanted to see all agencies that have clients on Shopify only, the table would show me most (agency with the most clients on Shopify) at the top to least (agency with the least clients on Shopify) at the bottom. Here’s how that filter may look:
-
Using 2 or more filters
If I wanted to use the same filter above (All agencies that have clients on Shopify) but then only view the agencies that match that criteria but are in Germany also, I would use the “Group” filter as following